Executive Summary:
Anecdotal use of the AT5K on
balanced antennas has been done where currents in the balanced transmission
line are observed to be unequal by a significant percentage in the 160M
band.
Speculation is that the AT5K
input balun may have poor or low Common Mode Impedance especially at low
operating frequencies, with the resulting common mode current upsetting
the way the tuning network presents a balanced source of current into a
balanced transmission line and antenna.
High ground return currents and
local interference and subsequent near field radiation have been observed.
Discussion as to the magnitude
of Common Mode Impedance on current baluns as a measure of merit has led
to empirical and instrument testing to characterize (or at least compare)
a few available commercial or home-made baluns.
A Two-Port Network Analyzer (HP
8714B) is used to attempt to quantify Common Mode Impedance in stock and
sample replacement current baluns. An S-Parameter measurement with analytical
reduction is planned as a check and validation of the network analyzer measured
results.
The stock AT5K input balun in SN 20235 has been observed to be comparatively lower in Common Mode Impedance than other candidates.
Detail:
Common Mode Impedance is a parameter
of concern for effective current baluns. Current baluns are often used to
decouple RF common mode currents that would form on the outside shield of
a coaxial feedline. A current balun is also frequently used provide a connection
to a two wire transmission line from a unbalanced coaxial transmission line.
A current balun is used on the input of the Palstar AT5K Coupler,to present
an unbalanced transmission line to the T-topology matching network when
the feature of driving a balanced transmission line is selected.
A series of measurements were
made with a 2 port network analyzer (HP-8714B). As a sidebar, an MFJ-835
Dual Current Meter was used to understand if balanced currents were present
in the transmission line connected to the AT5K. The MFJ-835 was modified
to additionally allow a dual trace scope to be used to observe phase as
well as transmission line current, at the suggestion of Greg W1ECB. That
information is included as an appendix to this report.
The stock AT5K balun (at least
as found in S/N 20235) is made with parallel wound high voltage wire, 9
turns on a two-core stack. As a transmission line, this does not present
50 Ohms, it is likely somewhat higher but it is speculated that in the application
the designers were not
so much concerned with building a near perfect 50 Ohm choke as they were
with presenting a high impedance to currents at the return side of the network
to ground. The inductance of the choke if prepared correctly should present
a high impedance at all frequencies of interest, with no spurious resonances
that would complicate the network transformation.
Discussions in the literature
suggest that 1000 Ohms is a good target, and higher is generally better,
and achievable. 1000 Ohms at 1.93 MHz would be about 82 uH. At 1.8 MHz about
88 uH. High Z across all frequencies is hard to achieve, and some very good
examples are made qualified by band and measurements. There is also a lot
of "this seems to work great" anecdotes that need caution.
The following images show the
setup and measurements made on the stock AT5K balun and one option made
up of the balun inside the Balun Design 1171t. Another test was done on
an unmodified Balun Design 1171t in the supplied weatherproof box, to understand
the influence of the extra length wire necessary to hook up in the AT5K
and any attendant parasitic effects. The primary interest of the group is
on lower frequencies, and specifically performance at 160M.
Calibration was done first with
a good Open, Short and 50 Ohm High RL Load from 1 to 50 MHz. There is a
valid argument that the analyzer is designed to work into a 50 Ohm transmission
line, and the parallel wound transmission line balun is likely higher than
50 Ohms. Correspondingly the accuracy of any of the results is a question,
though for comparison purposes the trends and gross magnitude of the differences
are useful.
There is a more accurate technique described by Pete WB2UAQ involving an open and short termination on the balun, and mathematical reduction of S-parameter data. It is expected that a later version of this analysis will incorporate those measurements for comparison, and any different conclusions.
.jpg)
Figure 1. Setup For Return Loss and Input Impedance
Figure 1 shows the setup for measurement of Input Return Loss and Input Impedance. The Analyzer reflected port was connected to the input of the balun, and the output was terminated in a known 50 Ohm load.
.jpg)
Figure 2. Return Loss of Stock Balun
Figure 2 shows the display on the analyzer as set to observe Return Loss (RL) vs frequency, with markers at four frequencies of interest. RL appears good at the low end of the spectrum with progressive deterioration at higher frequencies.
.jpg)
Figure 3. Input Impedance of Stock Balun
Figure 3 shows the same connection with the analyzer set to show Impedance on a Smith Chart presentation. Markers indicate the observed Impedance (R +/- jX). The balun appears inductive through the operating region.
.jpg)
Figure 4. Setup for Common Mode Impedance on Stock Balun
Figure 4 shows the setup to indicate Common Mode Impedance using the Reflected Port of the analyzer. Note this is predominantly a low frequency measurement, as the parasitics of the wiring will start to become meaningful and frequency is increased. Again, for comparative purposes and trends, this configuration is still interesting.
.jpg)
Figure 5. Common Mode Impedance Observed on Stock Balun
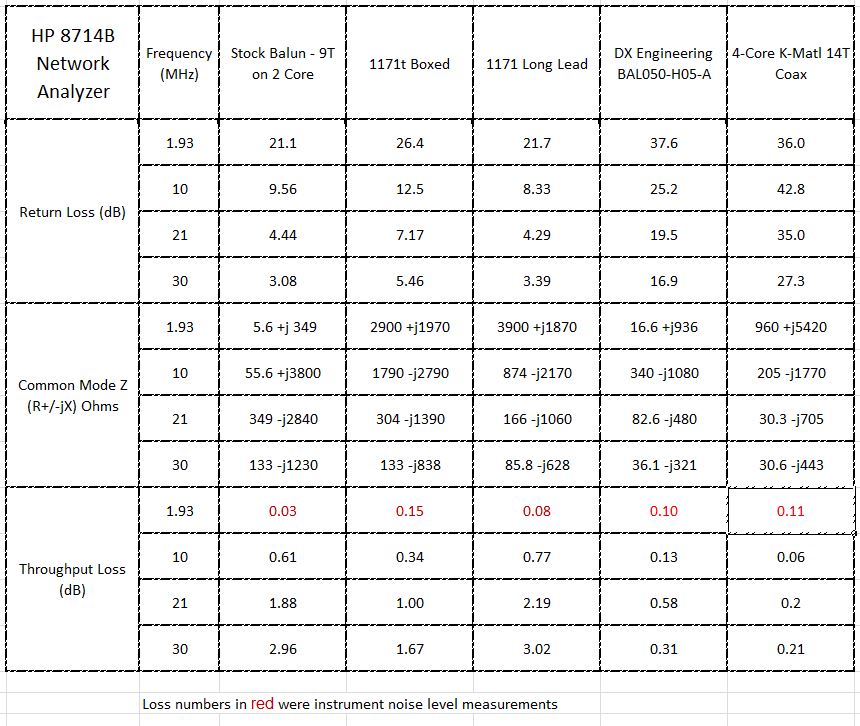
Figure 5 shows the display of the analyzer, indicating the Common Mode Impedance trends with the input and output of the balun terminated in 50 Ohms. Note the value observed at 1.93 MHz of approximately 5.6 +j349 Ohms which ideally would be in excess of 1K Ohms. There is noise observed in this measurement but the trend is interesting.
.jpg)
Figure 6. Setup Throughput Loss of Stock Balun
Figure 6 shows the setup used to measure throughput loss of the stock balun. The Transmission Port of the analyzer is fed to the output side of the balun for convenience.
.jpg)
Figure 7. Throughput Loss of Stock Balun
Loss is very low at the lower end of the spectrum and rises as expected at the higher end. It is expected that the loss with progressive frequency may involve heating of the balun depending on applied power. The loss is primarilly reflection related, as the network may provide a conjugate termination for the balun and stray wiring.
.jpg)
Figure 8. Boxed Balun Design 1171t Balun Return Loss Setup
Figure 8 shows the setup for measuring the Balun Design 1171t Balun RL in the weather resistant box configuration. This was done to characterize the balun ahead of the use of the same internal balun as this but with longer leads in the AT5K as a replacement for the stock balun.
.jpg)
Figure 9. Boxed Balun Design 1171t Balun Return Loss
Figure 9 shows the input RL for
the 1171t balun. There is a similar trend as the stock balun of reduced
RL at higher frequencies
.jpg)
Figure 10. Boxed Balun Design 1171t Input Impedance
Similar to the stock balun, the 1171t is primarily inductive throughout the HF spectrum, and likely goes resonant upwards of 50 MHz.
.jpg)
Figure 11. Boxed Balun Design 1171t Common Mode Impedance Setup
Figure 11 shows the setup for the measurement of Common Mode Impedance with 50 Ohm terminations on the input and output.
.jpg)
Figure 12. Boxed Balun Design 1171t Common Mode Impedance Results
Figure 12 shows measurements of the Common Mode Impedance seen on the 1171t in the boxed configuration. Note that at 1.93 MHz it appears to be approximately 2960 +j1970 Ohms, considerably higher than the stock balun performance. Also note that the impedance becomes capacitive in the mid and high spectrum frequencies.
.jpg)
Figure 13. Boxed Balun Design 1171t Throughput Loss Setup
Figure 13 shows the setup used to measure Throughput Loss on the 1171t.
.jpg)
Figure 14. Boxed Balun Design 1171t Throughput Loss Results
Note Throughput loss is low throughout the HF spectrum. The positive value on the loss at 1.93 MHz is due to noise in the measurement at low magnitudes. The loss is lower than the stock balun, possibly due to lower parasitic reactance in the shorted lead lengths.
.jpg)
Figure 15. 1171 Balun With Long Lead Lengths For Use in AT5K - RL Setup
Figure 15 shows the setup for measuring Input RL on a 1171 Balun Design Balun designed to be inserted as a replacement in the AT5K.
Figure 16. This Figure intentionally left blank
.jpg)
Figure 17. 1171 Balun With Long Lead Lengths Input Return Loss
Figure 17 shows the Input RL for the Long Lead 1171 Balun vs frequency. Note the RL is somewhat worse midway through the HF spectrum, likely complicated by lead length and dress. Measurement may be complicated by the nominal 50 Ohm terminations on a balun wound as a parallel wire transmission line, that is likely higher than 50 Ohms intrinsically. The AT5K network that in-circuit would terminate the balun, may present it with a closer to design impedance termination, yielding better results.
.jpg)
Figure 18. 1171 Balun With Long Leads Input Impedance
Figure 18 shows the Smith Chart representation of the input impedance of the 1171 balun. Note it is primarily inductive throughout the HF spectrum shifting capacitive above 30 MHz. The same complications due to lead length and dress, and questionable termination mismatch apply to the results, though the trend is consistent with the boxed balun measurements.
.jpg)
Figure 19. 1171 Balun With Long Leads Common Mode Impedance Setup
Figure 19 shows the setup for Common Mode Impedance measurements on the 1171 balun. The lead lengths and dress as well as terminations are likely influencers in the actual measurements.
.jpg)
Figure 20. 1171 Balun With Long Leads Common Mode Impedance Results
Figure 20 shows the Common Mode
Impedance results observed on the 1171 balun. Note the approximate Common
Mode Impedance is 3900 +j1870 Ohms at 1.93 MHz. Higher frequency measurements
may be influenced by the previous mentioned effects though the trend is
interesting.
.jpg)
Figure 21. 1171 Balun With Long Leads Throughput Loss Setup
Figure 21 shows the 1171 Balun Throughput Loss setup. The long leads are necessary for connections inside the AT5K.
.jpg)
Figure 22. 1171 Balun With Long Leads Throughput Loss Results
Figure 22 shows the Throughput Loss seen on the 1171 Balun with long leads. The positive value of loss seen at 1.93 MHz is due to noise in the measurement system at very low losses.
.jpg)
Figure 23. DXE Balun Input RL and Z Setup
Figure 23 shows the DXE Balun Input Return Loss and Impedance measurement setup.
.
.jpg)
Figure 24. DXE Balun Input Return Loss Results
Figure 24 shows the DXE Balun Input Return Loss, which appears good at lower frequencies and somewhat declines at the higher end of the HF spectrum. Acceptable as a load when terminated in characteristic impedance though up through 10M.
.jpg)
Figure 25. DXE Balun Input Impedance Results
Figure 25 shows the DXE Balun Input Impedance results. Note that it takes a turn towards the capacitive side around 25-30 MHz.
.jpg)
Figure 26. DXE Balun Common Mode Impedance Measurement Setup
Figure 26 shows the DXE Balun Common Mode Impedance measurement setup.
.jpg)
Figure 28. DXE Balun Common Mode Impedance Measurement Results
Figure 28 shows the DXE Balun Common Mode Impedance measurement results. The DXE Balul appears to be higher in Common Mode Z at the lower frequencies than the AT5K stock balun, but somewhat less than ideal at 160M. It is better in the 10 MHz region, and deteriorates in the higher end of the HF spectrum.
.jpg)
Figure 29. DXE Balun Throughput Loss Measurement Setup
Figure 29 shows the DXE Balun Throughput Loss measurement setup.
.jpg)
Figure 30. DXE Balun Throughput Loss Measurement Results
Figure 30 shows the DXE Balun Throughput Loss measurement results.
.jpg)
Figure 31. 4-Core K-Type 14T Coaxial Balun Return Loss and Impedance Measurement Setup
Figure 31 shows the 4-Core K-Type Coaxial Balun Return Loss and Impedance Measurement Setup. This balun has been suggested to the group as a possible remedy to the AT5K common mode isolation issue. Dan WA2YYQ uses a similar configuration in his modified AT5K.
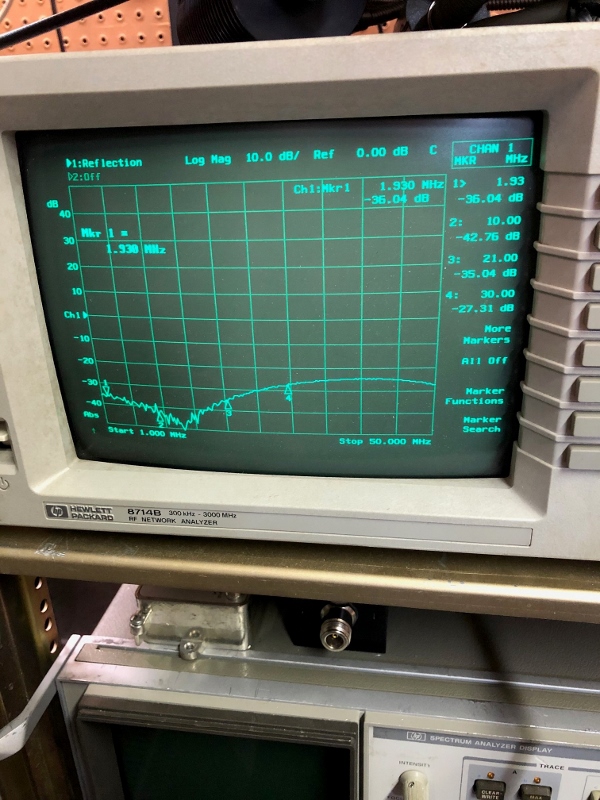
Figure 32. 4-Core K-Type 14T Coaxial Balun Return Loss Results
Figure 32 shows the 4-Core K-Type Coaxial Balun Return Loss results. The match through the HF spectrum is excellent.
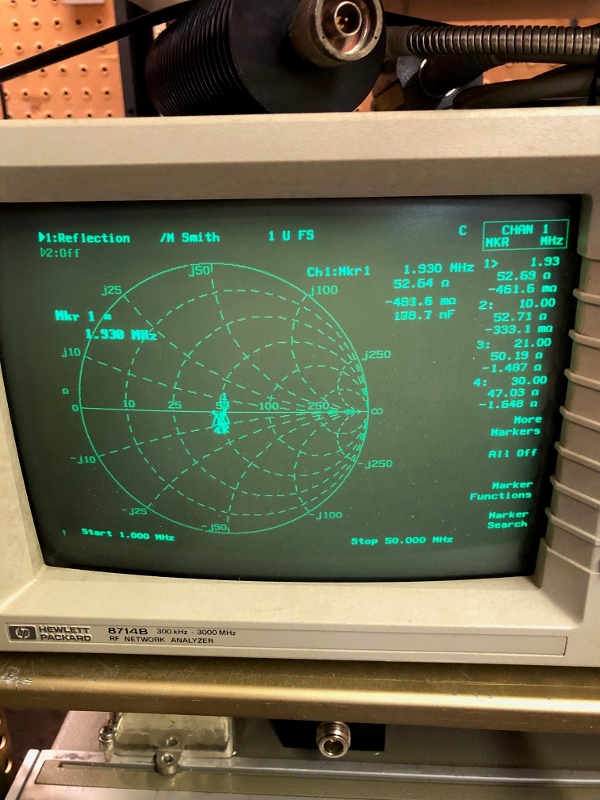
Figure 33. 4-Core K-Type 14T Coaxial Balun Input Impedance Results
Figure 33 shows the 4-Core K-Type Coaxial Balun Input Impedance results.
.jpg)
Figure 34. 4-Core K-Type 14T Coaxial Balun Common Mode Impedance Measurement Setup
Figure 34 shows the 4-Core K-Type Coaxial Balun Common Mode Impedance measurement setup.
.jpg)
Figure 35. 4-Core K-Type 14T Coaxial Balun Common Mode Impedance Measurement Results
Figure 35 shows the 4-Core K-Type Coaxial Balun Common Mode Impedance measurement results. Note the high K-Ohms trend at the lower frequencies and the falloff at the higher end of the HF spectrum. This measurement was somewhat jittery due to the high impedance presented by the balun. Clearly though the impedance is far over on the high impedance side of the chart. Note the equivilant inductance is approxomately 447 uH at 160M.
.jpg)
Figure 36. 4-Core K-Type 14T Coaxial Balun Throughput Loss Measurement Setup
Figure 36 shows the 4-Core K-Type Coaxial Balun Throughput Loss measurement setup.
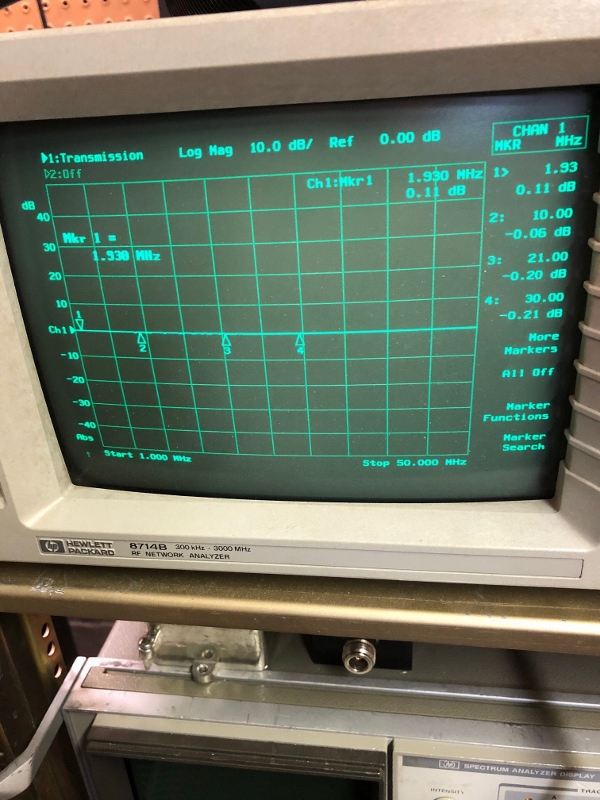
Figure 37. 4-Core K-Type 14T Coaxial Balun Throughput Loss Measurement Results
Figure 37 shows the 4-Core K-Type Coaxial Balun Throughput Loss measurement results. The balun shows low loss throught the HF spectrum.when terminated in characteristic impedances.
Summary
The 1171 Balun provided by Balun Design appears to have significantly higher Common Mode Impedance at low frequencies than the stock balun, though the exact values are arguably complicated by terminations, lead length and dress within the AT5K.
The 4-core K-Type 14T Coaxial Balun shows remarkably better performance at the low end of the HF spectrum.
The measurements made using the HP 8714B Network Analyzer may be complicated by the notion that the parallel wire wound transmission line balun architecture present a mismatch to the 50 Ohm port impedances of the analyzer.
Measurements may be made in the future using swept S-Paraameter data analytically reduced to provide more accurate results. This data will be compared to the results presented in the report.
Appendix 1. Modifications
to the MFJ-835 Dual RF Current Meter
Current balance is a goal in
the use of a balanced antenna and transmission line, to minimize radiation
from the feedline and resultant local interference issues that are installation
specific. The MFJ-835 Dual RF Current Meter is a useful tool and has been
used at several stations on the net to assess performance.
It has been suggested that a
modification to the MFJ-835 Dual Current Meter which samples the phase of
the current in the transmission line would be useful. The images below document
a way of achieving this with a one-turn sample in each of the current transformers
in the unit, brought out to BNC connectors with identical length coaxial
lines.
Empirical testing shows good balance of current using a home built balanced coupler, and nearly identical 180 degree phase on the line when set for minimum system reflected power and identical line currents.
.jpg)
Figure A1 Internal Modification to MFJ-835 With 1 Turn Sample Loops
.jpg)
Figure A2. BNC Connector Interface
.jpg)
Figure A3. Phase Measurement on Balanced Line